AI-POWERED CPG ANALYTICS

Ask your CPG data anything.

We plug your syndicated, distributor, and retailer data into an AI you can talk to — so anyone on your team can get a straight answer on sales, distribution, or velocity in seconds. No pivot tables, no waiting on an analyst, no dashboard hunting.

Still want a dashboard too? We build those — Power BI, built on the same clean data model.

ask-your-data.chat
What was our velocity vs YAGO at Whole Foods last month?
+18.7% vs YAGO. Distribution grew from 412 to 431 doors, with most of the gain in the West region.
ask a follow-up…

Common signs your data isn't working for you

Sound familiar? You're not alone — most CPG teams we meet are here.

Multiple data sources. No single source of truth.

— Your CEO

Dashboards exist, but no one trusts them.

— Your Sales Manager

Sales asks questions we can't answer fast.

— Your Marketing Manager

We're drowning in spreadsheets and weekly fire drills.

— You

If these sound familiar, you don't need more reports — you need a system that talks back.

Your data has answers. We help you find them.

Whatever you're sitting on — syndicated exports, distributor portals, direct retailer files — we structure it into one model your team (and your AI) can actually use.

SPINS NielsenIQ Circana

Syndicated Data

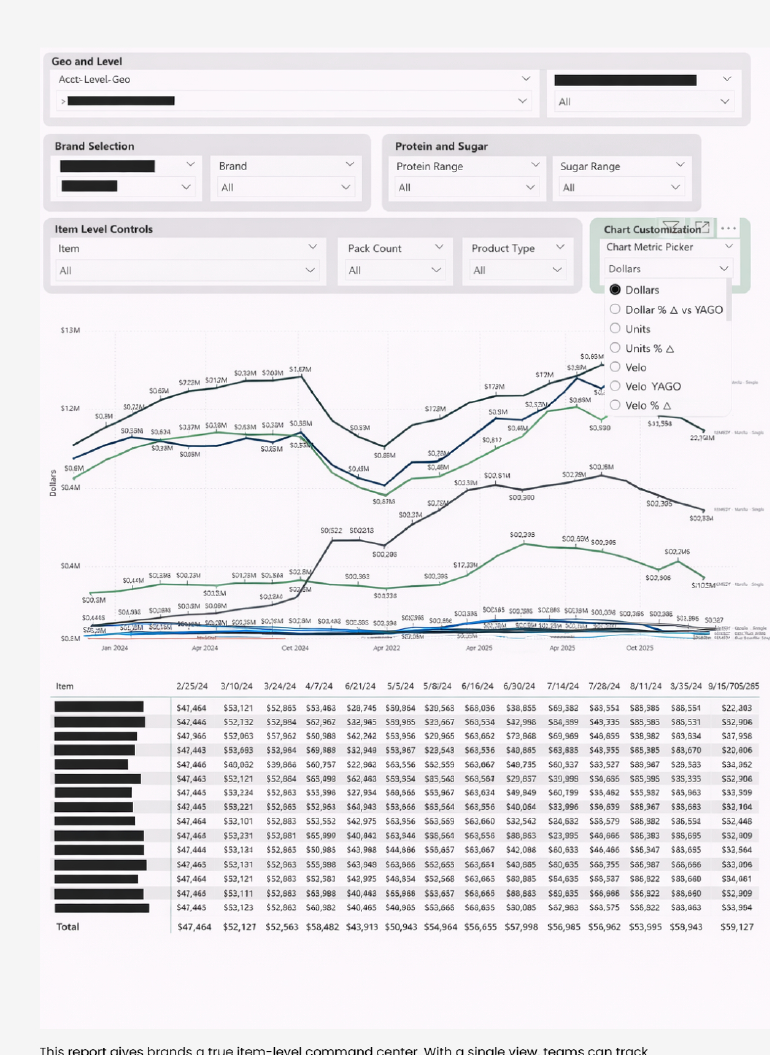
Syndicated data is powerful, but only if it's easy to use. We structure, normalize, and visualize it so teams can quickly understand trends, velocity, distribution, and performance — without digging through spreadsheets or static reports.

UNFI KeHE McLane C&S

Distributor Data

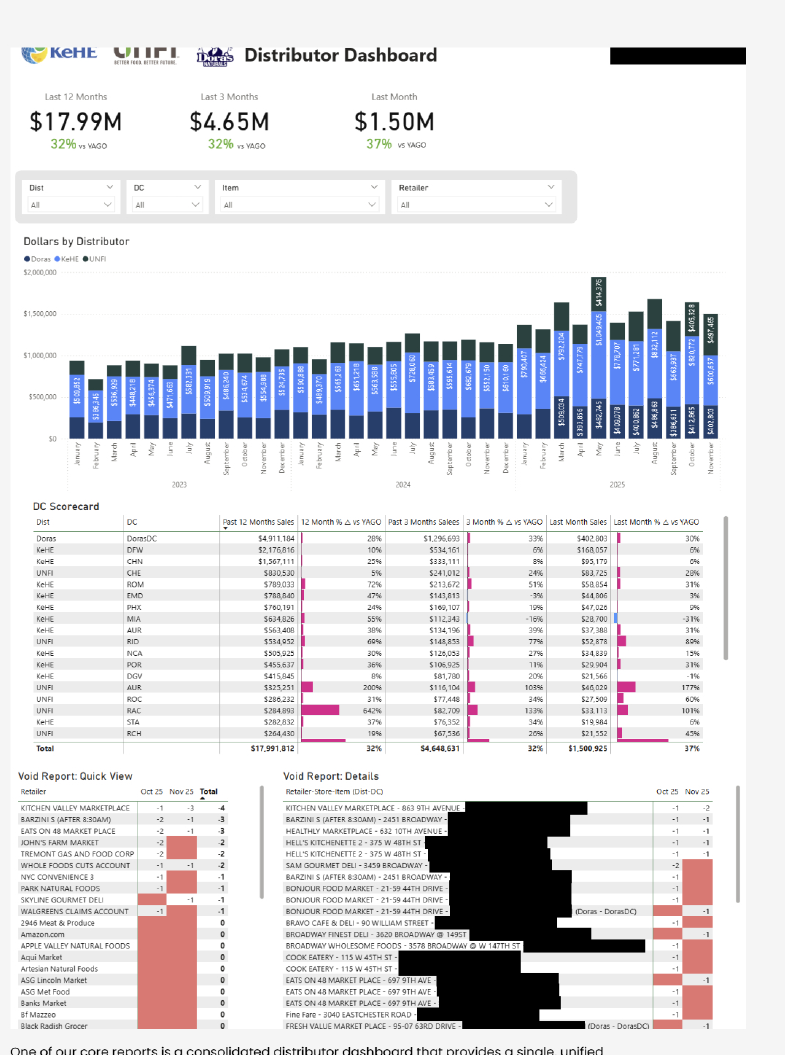
Distributor data is messy, inconsistent, and often underutilized. We consolidate feeds from partners like UNFI and KeHE into a single view — making it easy to understand performance by distributor, DC, item, or store, and quickly spot gaps and opportunities.

Whole Foods Walmart Kroger Costco

Direct Retailer Data

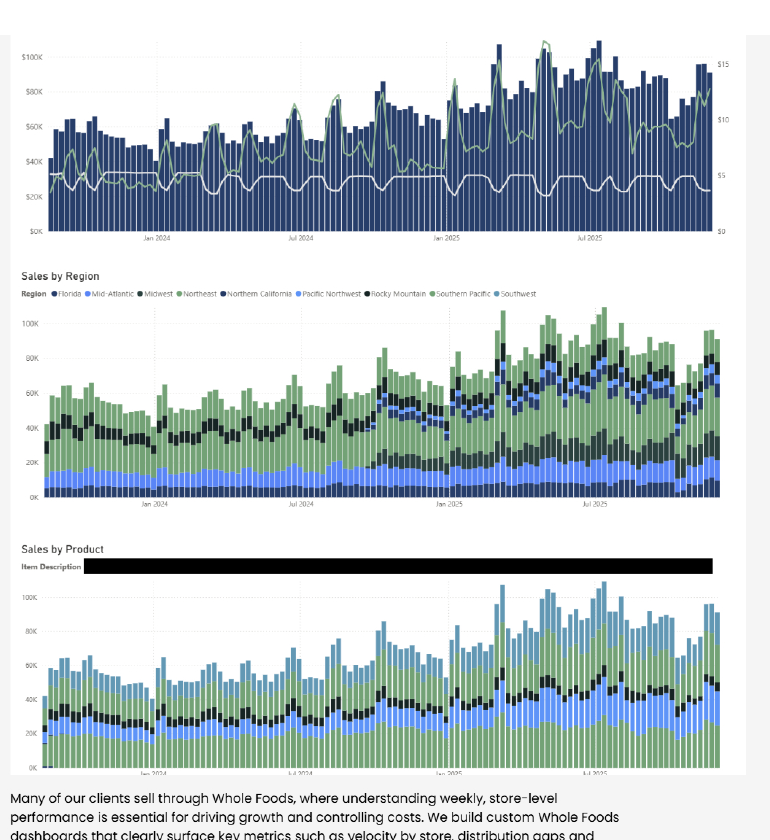
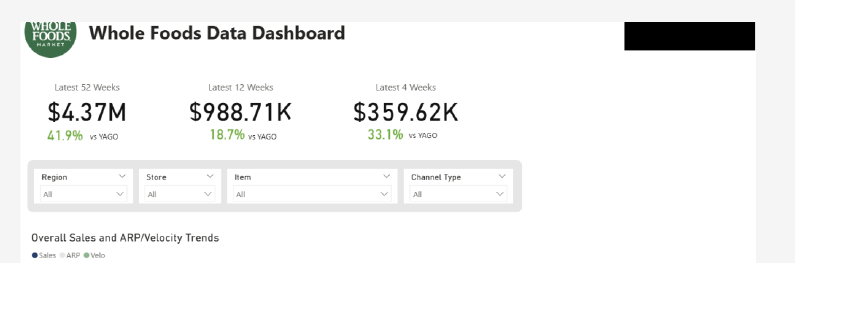
Whether it's Whole Foods, Walmart, Kroger, or another retailer, direct data can unlock powerful store-level insights. We transform raw retailer files into intuitive views that highlight velocity, distribution issues, and lost sales — so teams know exactly where to focus.

WHAT MAKES US DIFFERENT

Ask your data anything — in plain English.

Most CPG data projects stop at a dashboard. We go one step further: we take whatever sources you already have and set them up in AI, so anyone on your team can ask a question and get a grounded, accurate answer back — no analyst, no waiting, no SQL.

  • 01

    Connect everything

    Syndicated (SPINS, NielsenIQ, Circana), distributor (UNFI, KeHE, McLane, C&S), and direct retailer files — normalized into one queryable model.

  • 02

    Ask in plain English

    "What drove the velocity drop in the Southeast last period?" Type it like you'd ask a colleague — get a real answer back in seconds.

  • 03

    Grounded in your real numbers

    Every answer traces back to your underlying data — not a black box. You can always see the "why" behind the "what."

ask-your-data.chat
Which SKUs have the biggest distribution voids at Kroger?
Top 3 voids by store count: Item A (22), Item B (19), Item C (15) — est. $84K in lost sales over 4 weeks.
How's the new item trending vs. plan?
Tracking +11% ahead of plan on units, but ACV is behind pace in the Northeast — distribution is the gap, not velocity.
ask anything about your data…

Check out some real-world example dashboards

We still build the dashboards, too. Here's a look at the kind of reporting we've shipped for real CPG brands.
CPG Data Nerds have deep experience across natural, specialty, and emerging CPG brands.

Let's have a non-nerdy conversation about your data.

20 minutes. We'll tell you honestly whether we can help.

Book a 20 min fit call